Pixel precision.
Planetary scale.
Satellite-measured above-ground biomass, built for the decisions carbon markets, supply chains, and forest projects can't afford to get wrong.
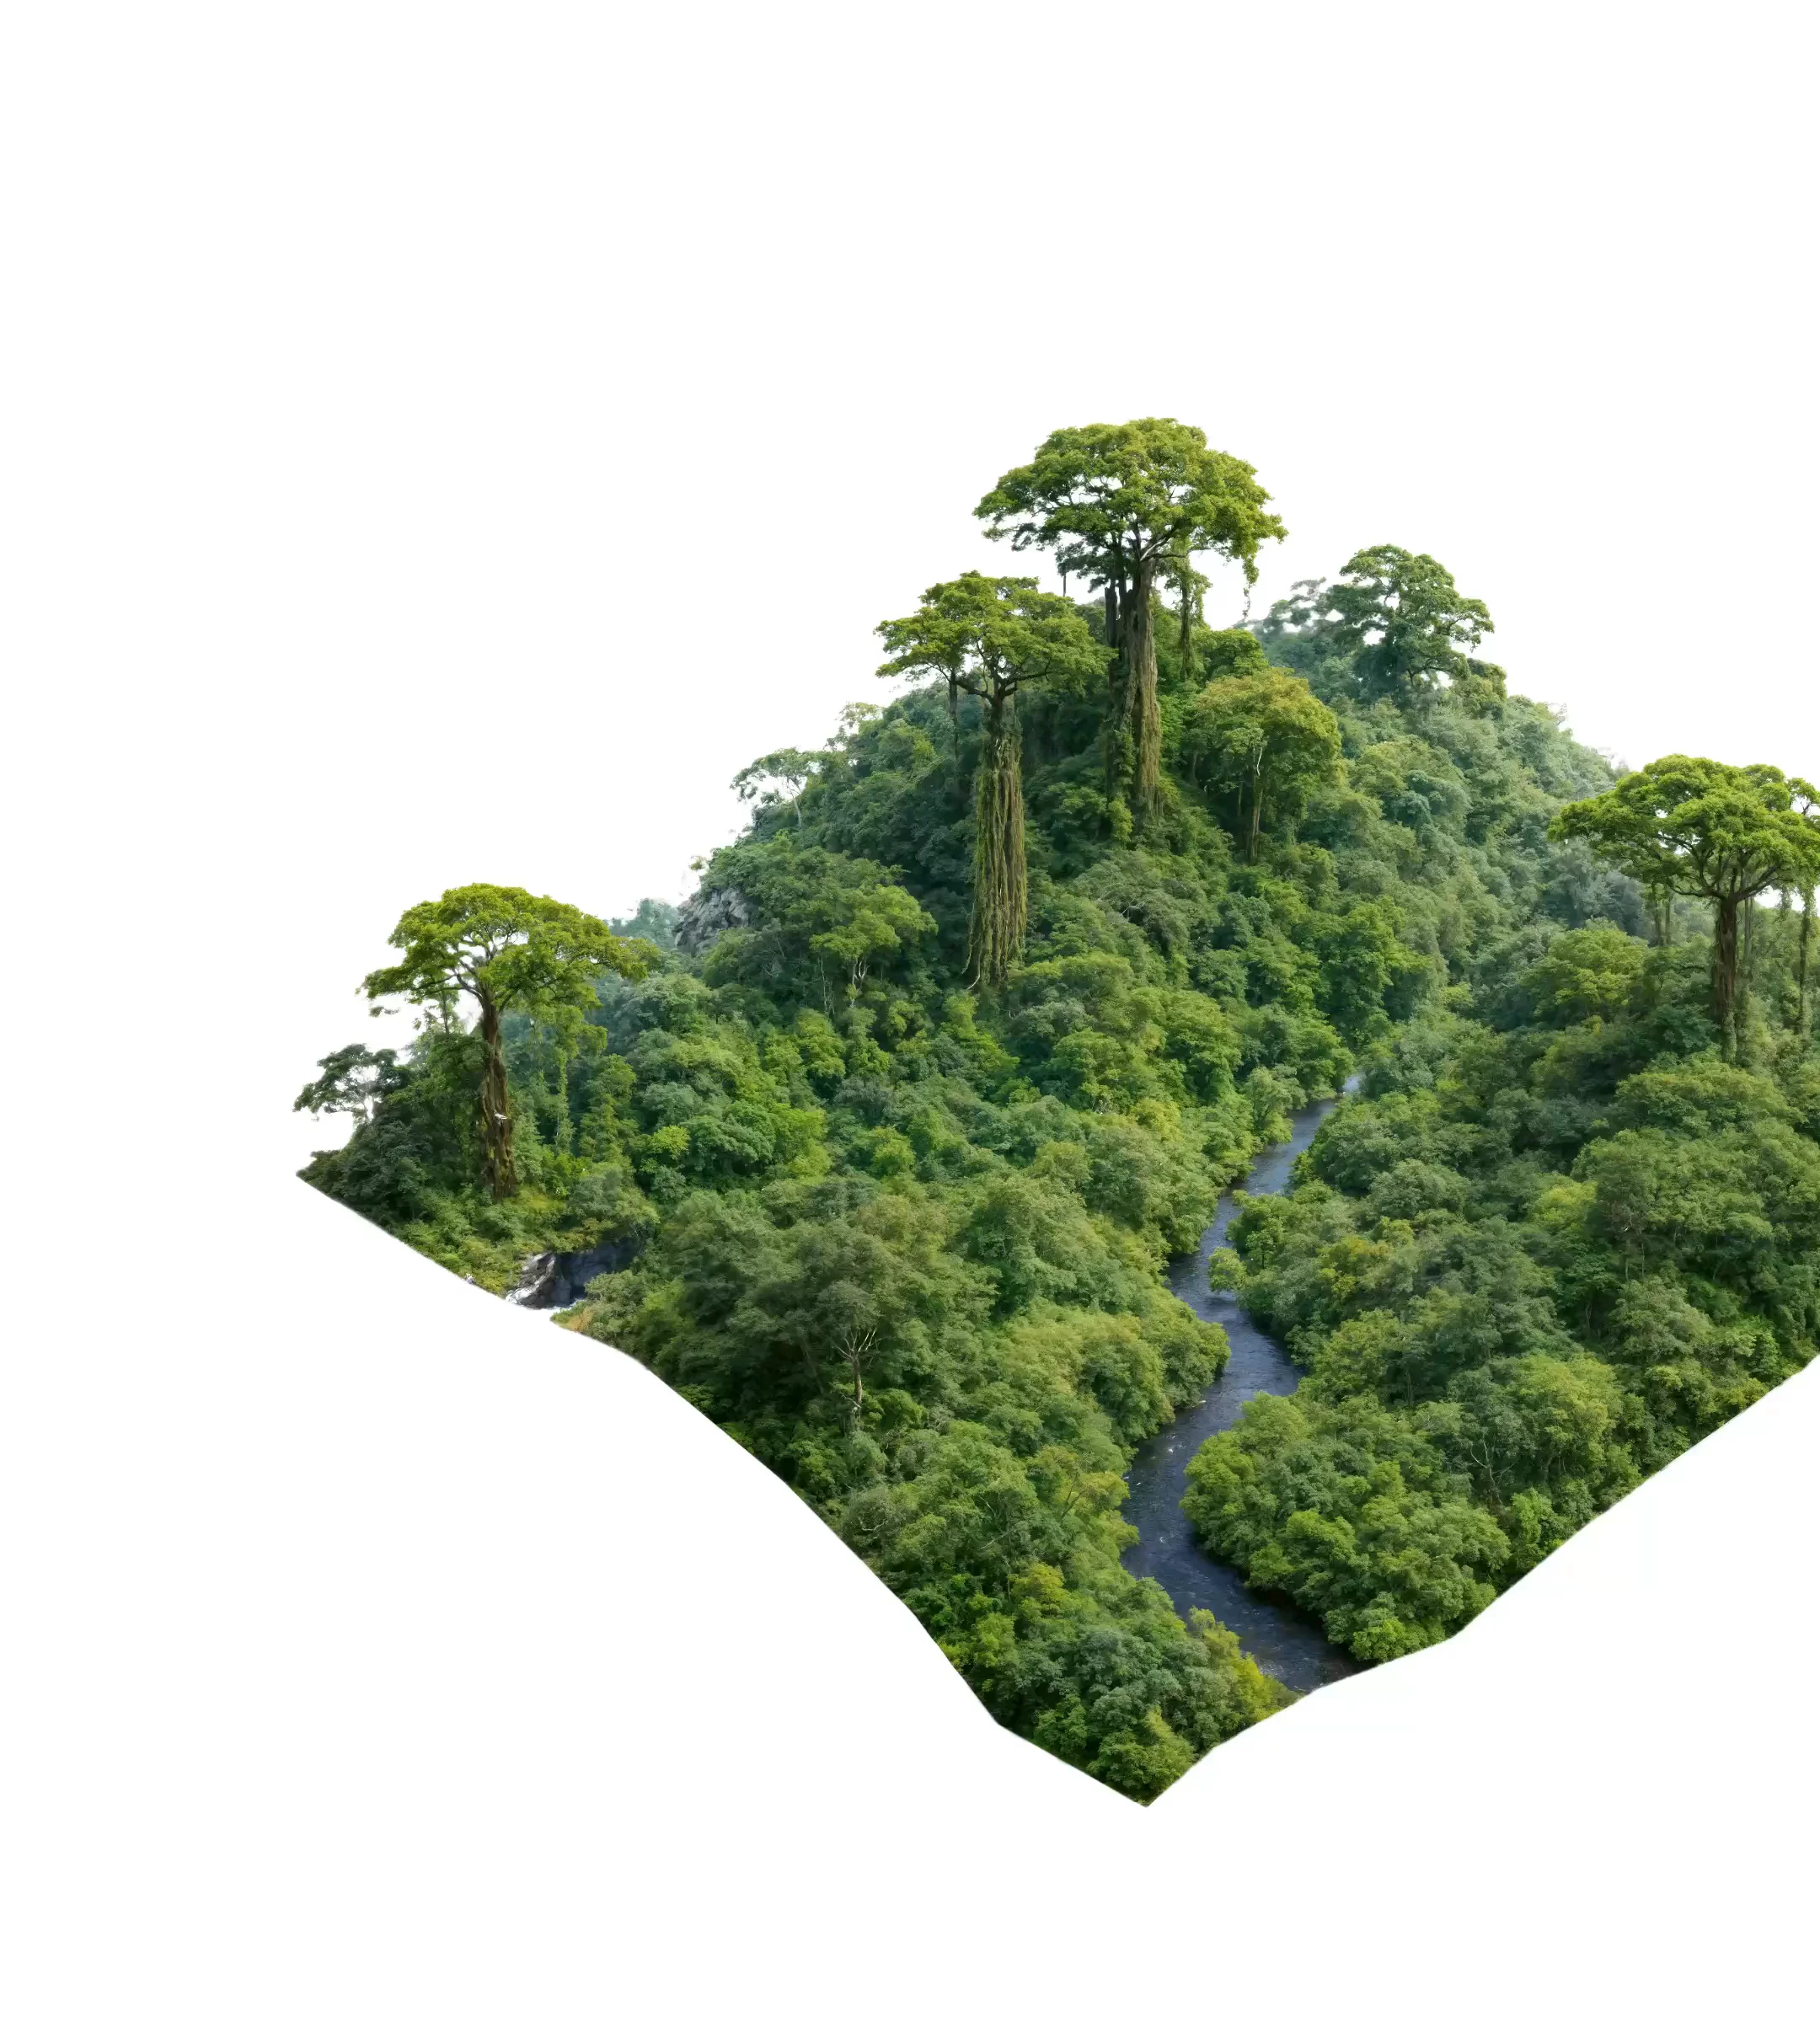


Understand the carbon density of any forest, anywhere. A complete picture of how much biomass exists across your area of interest, for decisions that hold up to scrutiny.
 10m and 30m resolutions
 Annual, from year 2000
 Pixel-level quantified uncertainty
Track how carbon stocks change year on year, or over any period since 2000. Detect deforestation and degradation, growth and recovery, and quantify the emissions and removals behind them with confidence.
Gross emissions and removalsSignificant change separated from noiseAny selected period since 2000
See exactly where forest is being lost, degraded, or gained. Toggle degradation and loss layers to isolate what matters most to your analysis.
Configurable canopy threshold (FAO, EUDR, custom)Monthly disturbance datingSub-hectare detectionOne continuous forest carbon record. Three layers, each built for a different decision: from understanding what exists today to tracking how it's changed since 2000.
Validated against NEON field surveys, airborne LiDAR, and GEDI spaceborne data across temperate and tropical forests on two continents.

From self-serve screening to custom enterprise deployments: the same forest carbon record, delivered in the format that fits your workflow.

Assess any area of interest before you invest in a forest carbon project. Rapid, satellite-based screening and due diligence, anywhere on the planet.

Establish credible, standards-aligned baselines and monitor carbon projects with confidence. High-quality dynamic baselines, reliable removals monitoring, and monthly biomass loss alerts included.

Consistent, standards-aligned biomass data and modeling for jurisdictional programs. Built for Jurisdictional REDD+ (JREDD) and MRV at scale.
Grounded in more than a decade of peer-reviewed, IPCC-recognised research: the science that makes forest carbon data defensible at any scale, for any forest, anywhere on Earth.
Active and passive Earth observation data (GEDI, Sentinel, and Landsat) fused to leverage the unique capability of each sensor. The fusion of multiple sensors eliminates gaps and produces consistent, reliable inputs across every geography.


Machine learning models convert fused satellite observations into wall-to-wall above-ground biomass estimates at annual time steps since 2000, with pixel-level quantified uncertainty at 10 and 30-metre resolution.
Spaceborne and airborne LiDAR estimates, combined with Earth observation imagery, provide millions of high-quality training points that capture the full range of above-ground biomass variability across vegetation types and ecosystems worldwide.

Spaceborne and airborne LiDAR estimates, combined with Earth observation imagery, provide millions of high-quality training points that capture the full range of above-ground biomass variability across vegetation types and ecosystems worldwide.
Active and passive Earth observation data (GEDI, Sentinel, and Landsat) fused to leverage the unique capability of each sensor. The fusion of multiple sensors eliminates gaps and produces consistent, reliable inputs across every geography.
Machine learning models convert fused satellite observations into wall-to-wall above-ground biomass estimates at annual time steps since 2000, with pixel-level quantified uncertainty at 10 and 30-metre resolution.
Chloris ranked among the top performers in a market-wide benchmarking exercise conducted by Equitable Earth, outperforming the majority of providers tested.

After a rigorous benchmarking process, Equitable Earth selected Chloris Geospatial as our monitoring partner. Their exceptional efficiency and precision in providing above-ground biomass data have significantly enhanced our project assessments, allowing us to make more accurate determinations of carbon stock and CO2 sequestration capacity in our project areas. Our collaboration with Chloris Geospatial, proving to be an invaluable asset with clear and measurable impacts on our operations, is now poised for a lasting and beneficial partnership.

Thibault Sorret
CEO, Equitable Earth
The Katingan Mentaya Project illustrates a broader truth about the voluntary carbon market: that the credibility of a carbon claim is only as strong as the measurement framework behind it. What is needed is a system that combines direct physical measurement with spatially continuous, annually updated, uncertainty-quantified data. That is what the integration of Chloris Geospatial data with Permian Global's field programme and satellite data streams provides.
Permian Global

We have produced a publicly available validation whitepaper, which details the result of our first external validation (quasi-ground truthing) campaign. We tested our aboveground biomass stock and change data against independent, high-quality Airborne Laser Scanning (ALS) data for a series of sites of various sizes and located in different ecosystems around the world. We will soon conclude another round of validation with the release of our 10m product, which will also be publicly available.
Using continental scale models, rather than local models, ensures our results are scalable from individual projects to entire jurisdictions. Combining this with a long times series means our models capture the full range of variation in carbon density over an area of interest.
Chloris Geospatial as a company does not go into the field. However, data that we use e.g. GEDI LiDAR has itself been trained with field data. Furthermore, the models that we use, which are based on the peer-reviewed work of our Chief Scientist, Dr Alessandro Baccini, have themselves been trained with extensive field sampling campaigns from 22 countries around the world by Alessandro.
Yes, our technology is suitable for monitoring small areas or plots like smallholder cocoa farms. We can go down to 0.09 ha resolution with our 30m product and 0.01 ha resolution with our 10m product.
Using a time series approach ensures we filter out non-statistically significant variation or noise and only identify statistically significant changes and trends in carbon stocks across time.
Regions that are prone to cloud cover generally have a higher level of uncertainty in comparison to regions that experience lower levels of cloud cover. Using a time series based approach and having a representative set of validation sites helps combat this.

