Used by leading project developers.
30-metre resolution and 26 years of records give project developers the baselines, MRV outputs, and independent validation that verification bodies and investors demand.


Quality, scale, and speed that hold up under audit. Built on 26 years of continuous, independently validated records.

Every estimate is independently validated, benchmarked, and peer-reviewed meeting the integrity and audit standards developers, buyers, and registries require.

Regional models built for global use, backed by a 26-year time series, deliver comparable results from a single project boundary to an entire jurisdiction.

Software-first workflows replace slow, costly field campaigns, accelerating screening, MRV, and market engagement without cutting corners on rigor.

Permian Global has been using Chloris' biomass data and maps, alongside field data, to assess carbon stocks and growth rates in our project areas. The Chloris data has proven to be highly valuable, significantly enhancing the efficiency of our field campaigns and the utility of field plot data. Our partnership, rooted in scientific rigor and high-integrity data, aims at bringing more confidence to the carbon markets by demonstrating the true climate impact of forest conservation projects.
Christopher Philipson
Carbon Analyst, Permian Global


From project screening to dynamic baselining, Chloris delivers the data and workflows carbon market developers, investors, and portfolio managers need to move with confidence.
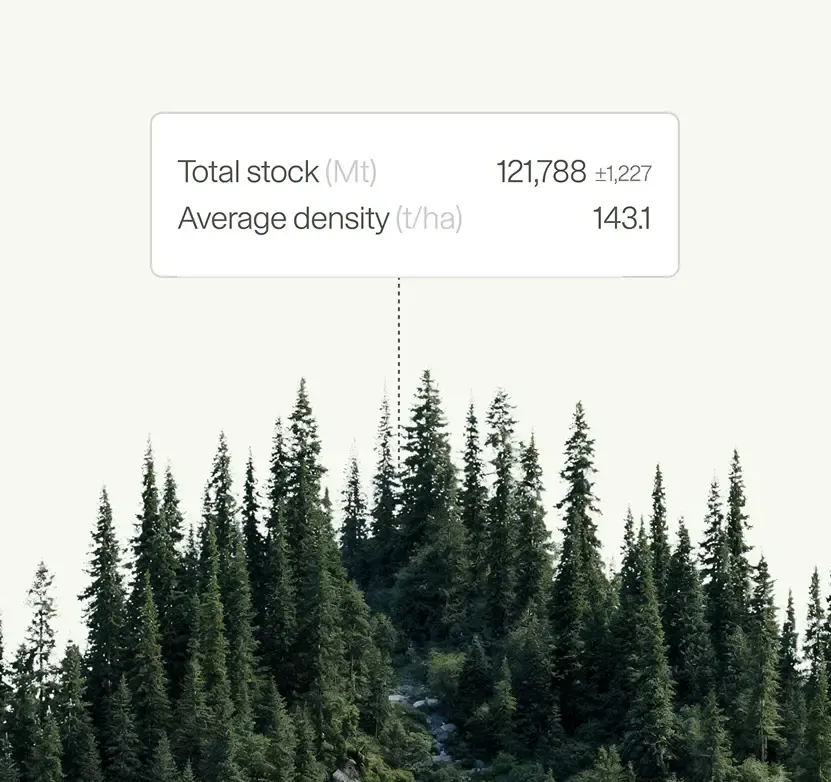
Screen and compare forest carbon projects across any geography before deploying teams or capital on the ground. 26 years of consistent, validated data, anywhere on Earth.
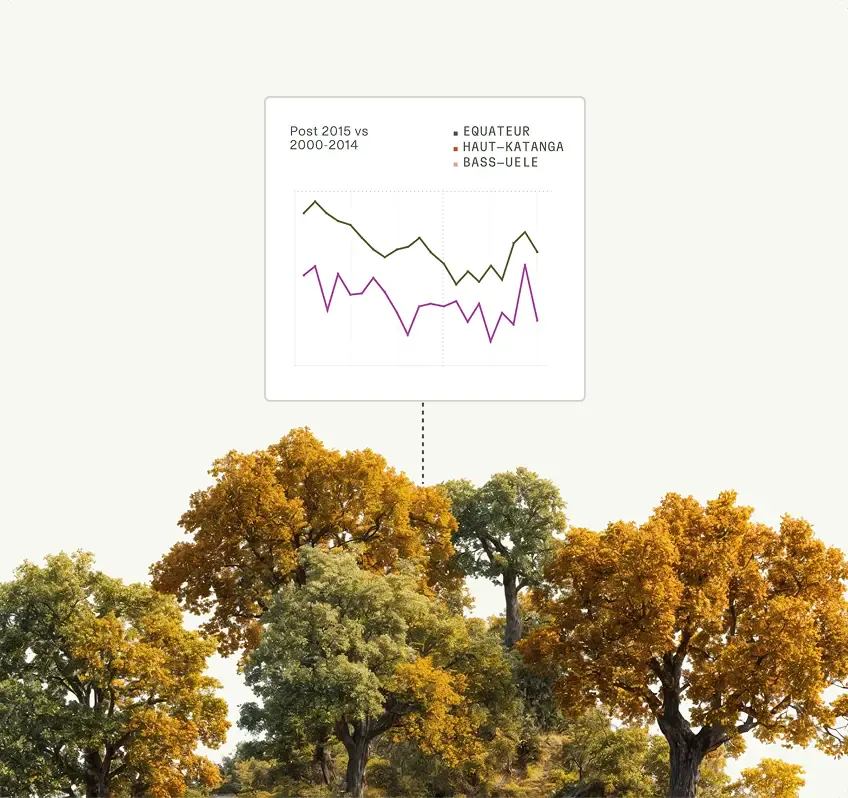
From project boundary to VVB-ready deliverables in 30 days or less, built on direct biomass data that holds up under scrutiny.
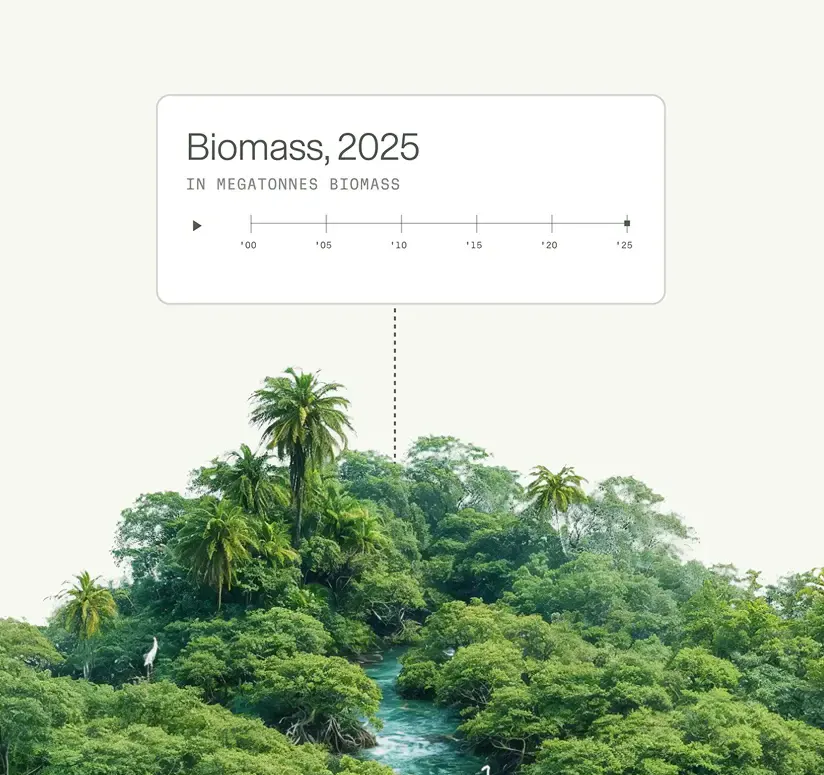
Track biomass performance, manage portfolios, and deliver credible insights that support confident decision-making across multiple forest sites.

The Katingan Mentaya Project in Central Kalimantan Province, Indonesia, protects 157,875 hectares of peat-swamp forest between the Katingan and Mentaya rivers. A triple gold rated forest carbon project, it generates an average of 6 million verified carbon units (VCUs) or carbon credits per year. It is a large, forested landscape, with deep peat soil underneath. There is no question that if the forest were to be cleared, the peat drained and the land converted, the resulting carbon dioxide emissions would be substantial. Its protection provides clear and significant climate benefits. But for the carbon credits the project generates to accurately compensate for actual, real-world emissions, there needs to be confidence in the overall volume of emissions the project is preventing.
Read Full Case Study 2. 6M
2. 6MVerified carbon units/year
 0
0Project fires recorded (2020–2023)
 157,875 ha
Peat-swamp forest protected
Validated against NEON field surveys, airborne LiDAR, and GEDI spaceborne data across temperate and tropical forests on two continents.

From screening tools to custom enterprise solutions: the same forest carbon record, delivered in the format that fits your workflow.

Analyze any area of interest to ensure confident investments in high-quality forest carbon projects. Rapid, satellite-based screening and due diligence, anywhere on the planet.

Track biomass performance, manage portfolios, and deliver credible insights that support confident decision-making across your entire project portfolio.

Establish credible, standards-aligned baselines for VM0047 Verra ARR projects. High-quality dynamic baselines, reliable removals monitoring, and monthly biomass loss alerts included.

Consistent, standards-aligned biomass data and modelling for jurisdictional programs and large-scale forest carbon decision-making. JREDD-ready, flexible, and built for MRV at scale.
Chloris is a partner, not a data vendor.
We work alongside project developers, investors, and portfolio managers from first screening through to verified, year-on-year monitoring, helping you design the approach, deliver the data, and stand behind the numbers.

A 25-year archive at 30m resolution lets you screen any area of interest, assess historical carbon dynamics, and establish feasibility before committing to a project area.
A 25-year archive at 30m resolution lets you screen any area of interest, assess historical carbon dynamics, and establish feasibility before committing to a project area.
Dynamic baselines aligned to VM0047, REDD+, and IFM methodologies, built on the full historical time series.
Defensible under registry and investor scrutiny, delivered in 30 days or less.
Dynamic baselines aligned to VM0047, REDD+, and IFM methodologies, built on the full historical time series.
Defensible under registry and investor scrutiny, delivered in 30 days or less.
Annual carbon stock and change across your project areas, distinguishing removals from emissions with consistent, comparable measurement year on year.
Data arrives VVB-ready, with documented methodology and a clear audit trail.
Annual carbon stock and change across your project areas, distinguishing removals from emissions with consistent, comparable measurement year on year.
Data arrives VVB-ready, with documented methodology and a clear audit trail.

Our involvement does not end at data delivery.
We support methodology design, help interpret results, and work alongside your team as frameworks and registry requirements evolve.

Our involvement does not end at data delivery.
We support methodology design, help interpret results, and work alongside your team as frameworks and registry requirements evolve.
Turning field measurements into a project-wide figure requires extrapolation, which introduces uncertainty and in a mosaic landscape like the Katingan Mentaya Project, that uncertainty can be substantial. The challenge, then, was to quantify this uncertainty at the pixel level across the entire project area, and to use it actively to guide where measurement effort should be concentrated.
Permian Global,
Project Developer


The Science Based Targets initiative published Version 2.0 of its Corporate Net-Zero Standard on 11 June 2026. The shift is from ambition to implementation. For most sectors that means greater flexibility in how targets are set and met. For companies sourcing forest and agricultural commodities, the implications are more specific because the most important changes sit in the treatment of Scope 3 emissions. The implications also carry a timing imperative: the evidence base the standard rewards takes years rather than months to assemble, so for a company that wants to use the new flexibility when V2.0 becomes mandatory on 1 January 2028, the work that matters should start soon.

Many financial institutions need to update how they assess their exposure to deforestation and land-use change emissions, and the update points in one direction: a geospatial lens on what is actually happening across the land their portfolios finance, as new net-zero standards are about to require banks and asset managers to measure and disclose the emissions embedded in their portfolios, including those tied to forests, land, and agriculture.

Forest carbon projects are built on a promise of permanence. But the threats to permanence can materialize in days, and the tools most project teams rely on to detect them were never designed to answer the question that matters most: how much carbon is actually at risk?
Most approaches estimate carbon by classifying land cover types and applying emission factors. Direct biomass estimation bypasses those definitions entirely, measuring carbon stocks and changes pixel by pixel.
This means degradation, growth, and recovery are all visible (not just events that trigger a land cover change) and results are comparable across projects and jurisdictions without the errors introduced by mismatched classification systems.
Every estimate carries quantified uncertainty at the pixel level: for stock, change, and forest area, at both 10m and 30m resolution, with a 95% confidence interval. Our technology detects not just deforestation but degradation, growth, and regrowth, capturing the full picture of vegetation dynamics.
Training at continental scale, rather than locally, ensures results are consistent and comparable from individual project boundaries to entire jurisdictions. Combined with a time series going back to 2000, our models capture the full range of carbon density variation across every vegetation type and ecosystem in an area of interest.
A time series approach filters out noise and non-statistically significant variation, so only real, statistically significant changes in carbon stocks are identified. This produces more reliable emissions and removals estimates than any single-year snapshot could provide.
We apply a biomass threshold at the pixel level to distinguish forest from non-forest, following country-specific definitions based on canopy cover. The corresponding biomass density is calculated for each location, producing a threshold that is locally accurate rather than applied as a global default.
Yes. Chloris data is designed to meet the integrity and audit requirements of leading standards bodies and VVBs in the voluntary carbon market, supporting dynamic baselining, MRV, and portfolio monitoring under methodologies like VM0047.

